June 21 is a day to #ShowYourStripes by spreading awareness about climate change through an iconic graphic that shows warming trends.
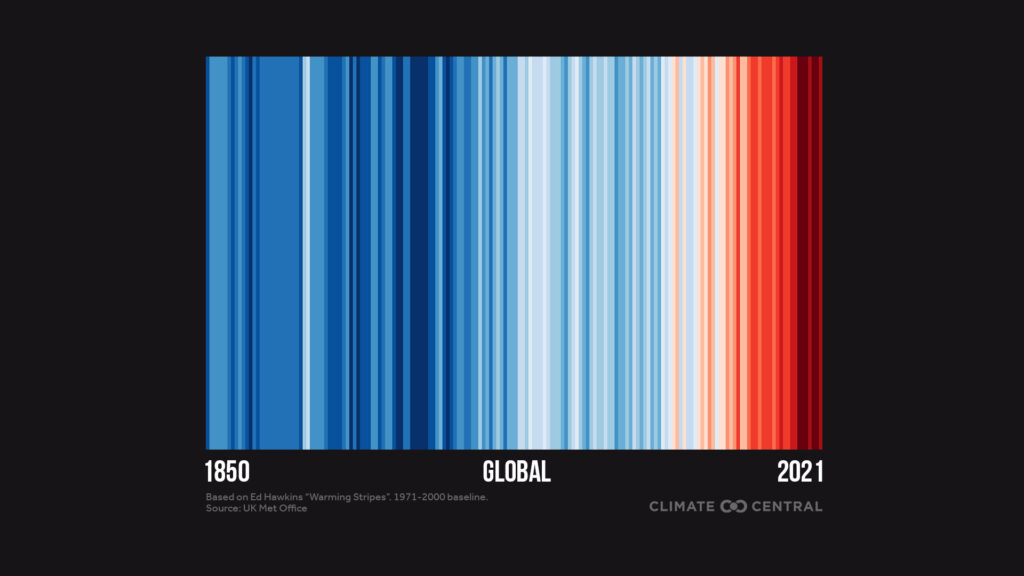
Professor Ed Hawkins, a climate scientist at the University of Reading, created the “warming stripes” graphic to illustrate the long-term increase in temperatures due to climate change. Each stripe represents the average global temperature every year since 1850.
Blue stripes are years that were cooler than the 1971-2000 average, while red stripes are years that were hotter than the average. The graphic shows a shift from blue to red stripes in recent decades as greenhouse gas emissions have warmed the planet.
Today is the sixth annual #ShowYourStripes Day. The nonprofit organization Climate Central promotes the day as a time for meteorologists and other communicators to spread the graphic in order to raise awareness of our warming planet.
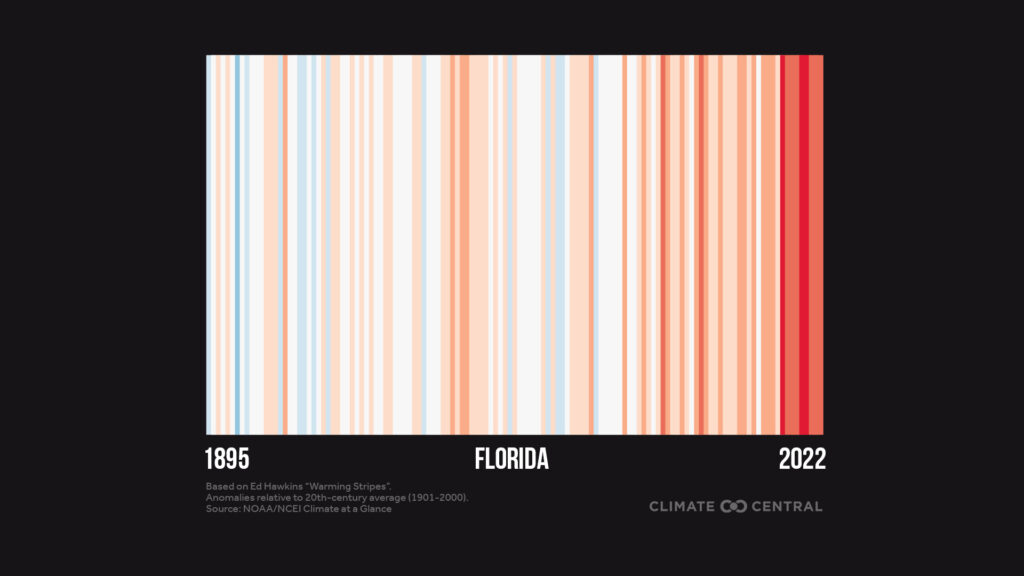
Climate Central analyzed temperature data through 2022 to create warming stripes graphics for the entire U.S. along with 178 individual cities and 49 states (Hawaii excluded). Each graphic shows more than 100 years of temperature change relative to the 1901-2000 average.
Most locations show a strong warming trend. Tampa was among the cities that was especially warm last year relative to the long-term average. To find your location on Climate Central’s website and download graphics, click here.

This year for the first time, landmarks in cities across the North America will light up in honor of #ShowYourStripes Day. June 21 was chosen for the day because it is the summer solstice, beginning the time of year when extreme heat, hurricanes and wildfires typically occur.
This year, there has been an early start to tropical storms and wildfires as temperatures have set new records. Both North and South America set a record-high temperature for May, the National Oceanic and Atmospheric Administration reported.
The global ocean surface temperature also hit a record high in May, marking the second-straight month when that temperature broke a record. The combined global ocean and land temperature was the third warmest since records started being kept in 1850, the agency reported last week in its monthly climate update.
Florida experienced its warmest January to May on record and is expected to have above-normal temperatures through the summer, according to the update.
Nathan Crabbe (ncrabbe@fau.edu) is editor of The Invading Sea. Sign up for The Invading Sea newsletter by visiting here.


