By Allan March

Planet Earth is heating up, much like you and me when we run a fever. When planet Earth has a fever she develops stronger wind velocities, heavier hourly rainfall and longer periods of drought. In contrast, human fevers are characterized by generalized aching, fatigue and feeling chilled.
In both cases temperatures rise in response to pyrogens. For planet Earth, pyrogens come in the form of the greenhouse gases carbon dioxide, methane and hydrofluorocarbons. These gases accumulate in the lower part of the atmosphere, blocking the outflow of infrared energy and thereby warming the planet. Human pyrogens come in the form of proteins that are released by cells in the blood, liver and lungs in response to infection and inflammation.
To detect a human fever all one needs is a thermometer. An oral temperature of 98.6 degrees on the Fahrenheit scale is normal for everyone and it has been this way for hundreds of years. And over the course of a day, a person’s normal temperature varies less than a degree
However, detecting a fever on Earth is not so easy. Temperature readings depend on time of day, season of year, altitude, latitude, ocean proximity, cloud cover, etc. Historical temperatures likewise have been influenced by volcanic eruptions, industrial development, deforestation and other factors. Until recently, there has been no scale indicating whether a local temperature is above normal and how much it deviates from pre-industrial times.

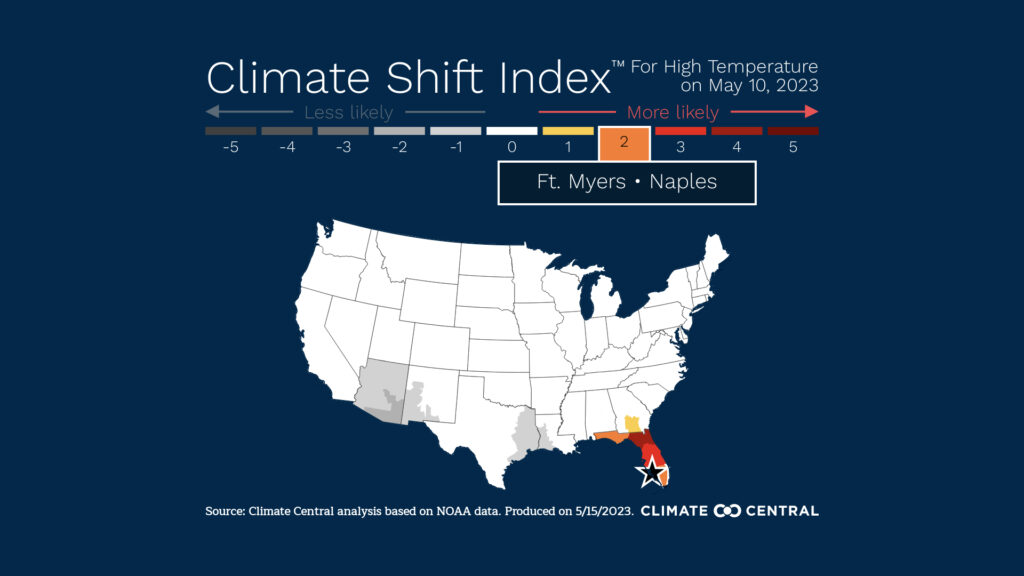
But last year climate scientists at Climate Central in Princeton, New Jersey, created a scale that indicates the degree to which a local climate has shifted as a result of greenhouse gases generated by human activity. The Climate Shift Index (CSI) provides insight into the local climate of over 1,000 worldwide locations, including 11 cities in Florida: Fort Myers-Naples, Gainesville, Jacksonville, Miami, Orlando, Pensacola, Panama City, Sarasota, Tallahassee, Tampa and West Palm Beach.
The CSI scale runs from -5 to +5. A CSI of -5 means that the day’s average temperature is at least 5 times less likely because of manmade greenhouse gases. At the other end of the scale, a CSI of +5 means that the day’s average temperature is at least 5 times more likely because of these same anthropogenic pyrogens.
The CSI can help determine the location of the greatest consequences of Earth’s fever. After evaluating the CSI for 1,000 worldwide cities over a recent period of 12 months, the greatest CSI effects were found near the equator. Moroni, Comoros, an island off the east coast of Africa, had an average CSI of +4.1 and the most number of daily CSI readings of +3 or above.

By including population, researchers found that that the greatest human impact occurred in Lagos, Nigeria, with 2.8 billion human days per year of CSI of +3 or more. Not surprisingly Mogadishu, Somalia, was also in the top 10 of such cities with 538 million human days per year with CSI of +3 or more.
Here in the United States, the CSI daily average temperature map (csi.climatecentral.org) provides insight into the spring flood along the Mississippi River. On April 11, 12 and 13 several cities along the upper Mississippi, Minnesota and St. Croix Rivers experienced CSIs of +2 and +3. This heat wave occurred in the context of a heavier than normal winter snow fall. The resulting high rate of melting snow along with other weather conditions produced moderately severe flooding downstream, where Dubuque, Iowa, endured a major flood stage on April 29.
Allan March is a climate activist and retired physician living in Gainesville.
If you are interested in submitting an opinion piece to The Invading Sea, email Editor Nathan Crabbe at ncrabbe@fau.edu. Sign up for The Invading Sea newsletter by visiting here.


